UncertainDataset
Collections of uncertain values are resampled by element-wise sampling the furnishing distributions of the uncertain values in the collection. You may sample the collection as it is, or apply sampling constraints that limit the support of the individual data value distributions.
The following methods will work for any collection type included in the UVAL_COLLECTION_TYPES type union.
Single realisation
No constraint
UncertainData.Resampling.resample — Methodresample(x::UVAL_COLLECTION_TYPES, constraint::SamplingConstraint, n::Int) -> Vector{Vector{T}} where TResample x (a collection of uncertain values) once by drawing a single random number from each of the uncertain values in x.
See also UVAL_COLLECTION_TYPES.
Example
# Generate some uncertain values represented by gamma distributions
uvals = [UncertainValue(Gamma(i, rand())) for i = 1:100]

# Resample the collection once
resample(uvals)Same constraint applied to all values
UncertainData.Resampling.resample — Methodresample(x::UVAL_COLLECTION_TYPES, constraint::SamplingConstraint) -> Vector{T} where TResample x (a collection of uncertain values) once, applying the provided sampling constraint.
Returns a length(x)-element vector. The i-th element of this vector is generated by truncating the i-th uncertain value by the sampling constraint, then drawing a single random number from the truncated value.
See also UVAL_COLLECTION_TYPES.
Example
# Generate some uncertain values where the `i`-th value is given by a normal
# distribution with mean `i` and a standard deviation drawn from a uniform
# distribution on `[0, 1]`.
uvals = [UncertainValue(Normal(i, rand())) for i = 1:100]

# Truncate each distribution at +- 0.5 standard deviations, then resample.
resample(uvals, TruncateStd(0.5))Different constraints applied to each value
UncertainData.Resampling.resample — Methodresample(x::UVAL_COLLECTION_TYPES, constraint::Vector{<:SamplingConstraint}) -> Vector{T} where TResample x (a collection of uncertain values) once, applying the provided sampling constraints. The number of constraints must match the number of elements in x.
Returns a length(x)-element vector. The i-th element of this vector is generated by truncating the i-th uncertain value by the i-th sampling constraint, then drawing a single random number from the truncated value.
See also UVAL_COLLECTION_TYPES.
Example
# Generate some uncertain values where the `i`-th value is given by a normal
# distribution with mean `i` and a standard deviation drawn from a uniform
# distribution on `[0, 1]`.
uvals = [UncertainValue(Normal(i, rand())) for i = 1:100]

# Truncate each distribution at +- 0.5 standard deviations, then resample.
resample(uvals, TruncateStd(0.5))Multiple realisations
No constraint
UncertainData.Resampling.resample — Methodresample(uvd::UVAL_COLLECTION_TYPES, n::Int) -> Vector{Vector{T}}Draw n realisations of an uncertain value dataset according to the distributions of the uncertain values comprising it.
See also UVAL_COLLECTION_TYPES.
Example
# Generate some uncertain values represented by gamma distributions
uvals = [UncertainValue(Gamma(i, rand())) for i = 1:100]

# Resample the collection once
resample(uvals)Same constraint applied to all values
UncertainData.Resampling.resample — Methodresample(x::UVAL_COLLECTION_TYPES, constraint::SamplingConstraint, n::Int) -> Vector{Vector{T}} where TResample x (a collection of uncertain values) n times, applying the provided sampling constraint.
Returns an n-element vector of length(x)-element vectors. Each of these vectors is an independent draw from x. The i-th element of each draw is generated by truncating the i-th uncertain value by the sampling constraint, then drawing a single random number from the truncated value.
See also UVAL_COLLECTION_TYPES.
Example
# Generate some uncertain values where the `i`-th value is given by a normal
# distribution with mean `i` and a standard deviation drawn from a uniform
# distribution on `[0, 1]`.
uvals = [UncertainValue(Normal(i, rand())) for i = 1:100]

# Truncate the first 50 elements at the 90th percentile range, and the
# last 50 elements at the 40th percentile range.
constraints = [i <= 50 ? TruncateQuantiles(0.05, 0.95) : TruncateQuantiles(0.3, 0.7) for i = 1:100]

# Truncate the distributions, then draw ten independent realisations of the collection subject
# to the provided constraints.
resample(uvals, constraints, 10)Different constraints applied to each value
UncertainData.Resampling.resample — Methodresample(x::UVAL_COLLECTION_TYPES, constraint::Vector{<:SamplingConstraint}, n::Int) -> Vector{Vector{T}} where TResample x (a collection of uncertain values) n times, applying the provided sampling constraints.
Returns an n-element vector of length(x)-element vectors. Each of these vectors is an independent draw from x. The i-th element of each draw is generated by truncating the i-th uncertain value by the i-th sampling constraint, then drawing a single random number from the truncated value.
See also UVAL_COLLECTION_TYPES.
Example
# Generate some uncertain values where the `i`-th value is given by a normal
# distribution with mean `i` and a standard deviation drawn from a uniform
# distribution on `[0, 1]`.
uvals = [UncertainValue(Normal(i, rand())) for i = 1:100]

# Truncate the first 50 elements at `± 0.5` standard deviations, and the
# last 50 elements at `± 1.2` standar deviations.
constraints = [i <= 50 ? TruncateStd(0.5) : TruncateStd(1.2) for i = 1:100]

# Apply the constraints element-wise, then draw ten independent realisations
# of the collection subject to those constraints.
resample(uvals, constraints, 10)Examples
Resampling with sampling constraints
Consider the following example where we had a bunch of different measurements.
The first ten measurements (r1) are normally distributed values with mean μ = 0 ± 0.4 and standard deviation σ = 0.5 ± 0.1. The next measurement r2 is actually a sample consisting of 9850 replicates. Upon plotting it, we see that it has some complex distribution which we have to estimate using a kernel density approach (calling UncertainValue without any additional argument triggers kernel density estimation). Next, we have distribution r3 that upon plotting looks uniform, so we approximate it by a uniform distribution. Finally, the last two uncertain values r4 and r5 are represented by a normal and a gamma distribution with known parameters.
To plot these data, we gather them in an UncertainDataset.
dist1 = Uniform(-0.4, 0.4)
dist2 = Uniform(-0.1, 0.1)
r1 = [UncertainValue(Normal, 0 + rand(dist), 0.5 + rand(dist2)) for i = 1:10]
 # now drawn from a uniform distribution, but simulates
r2 = UncertainValue(rand(9850))
r3 = UncertainValue(Uniform, rand(10000))
r4 = UncertainValue(Normal, -0.1, 0.5)
r5 = UncertainValue(Gamma, 0.4, 0.8)

uvals = [r1; r2; r3; r4; r5]
udata = UncertainDataset(uvals);
By default, the plot recipe for uncertain datasets will plot the median value with the 33rd to 67th percentile range (roughly equivalent to a one standard deviation for normally distributed values). You may change the percentile range by providing a two-element vector to the plot function.
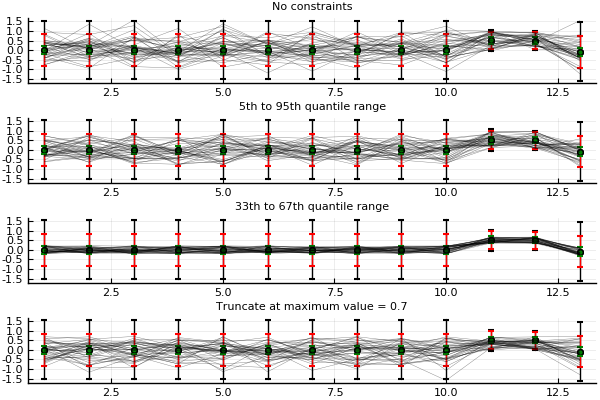
Let's demonstrate this by creating a function that plots the uncertain values with errors bars covering the 0.1st to 99.9th, the 5th to 95th, and the 33rd to 67th percentile ranges. The function will also take a sampling constraint, then resample the dataset a number of times and plot the individual realizations as lines.
using UncertainData, Plots

function resample_plot(data, sampling_constraint; n_resample_draws = 40)
    p = plot(lw = 0.5)
    scatter!(data, [0.001, 0.999], seriescolor = :black)
    scatter!(data, [0.05, 0.95], seriescolor = :red)
    scatter!(data, [0.33, 0.67], seriescolor = :green)

    plot!(resample(data, sampling_constraint, n_resample_draws),
        lc = :black, lw = 0.3, lα = 0.5)
    return p
end

# Now, resample using some different constraints and compare the plots
p1 = resample_plot(udata, NoConstraint())
title!("No constraints")
p2 = resample_plot(udata, TruncateQuantiles(0.05, 0.95))
title!("5th to 95th quantile range")
p3 = resample_plot(udata, TruncateQuantiles(0.33, 0.67))
title!("33th to 67th quantile range")
p4 = resample_plot(udata, TruncateMaximum(0.7))
title!("Truncate at maximum value = 0.7")

plot(p1, p2, p3, p4, layout = (4, 1), titlefont = font(8))
This produces the following plot:
What happens when applying invalid constraints to a dataset?
In the example above, the resampling worked fine because all the constraints were applicable to the data. However, it could happen that the constraint is not applicable to all uncertain values in the dataset. For example, applying a TruncateMaximum(2) constraint to an uncertain value u defined by u = UncertainValue(Uniform, 4, 5) would not work, because the support of u would be empty after applying the constraint.
To check if a constraint yields a nonempty truncated uncertain value, use the support_intersection function. If the result of `support_intersection(uval1, uval2) for two uncertain values uval1 and uval2 is the empty set ∅, then you'll run into trouble.
To check for such cases for an entire dataset, you can use the verify_constraints(udata::AbstractUncertainValueDataset, constraint::SamplingConstraint) function. It will apply the constraint to each value and return the indices of the values for which applying the constraint would result in a furnishing distribution whose support is the empty set.